When a group of colleges form a strategic partnership, they typically work together to share resources, expertise and a collaborative approach to planning.
Could sharing data help the partnership to become more effective? For example, could sharing information about applications, enrollments, outcomes and destinations help the colleges to work together to provide a more structured, joined-up offer to young people in the area to secure economic development of the region?
This post is co-authored by members of a forward-looking partnership from South East Wales who set out to explore just that, working as part of the Jisc College Analytics Lab project.
Project Structure
This short, three-month pilot project started with a face-to-face workshop to establish which business questions and data sources we would explore first. Business requirements were expressed as user stories. Following agile principles, we then worked in time-bound ‘sprints’, with regular online meetings to review and reflect on progress and adjust project priorities if required.
High Level User Story (‘Epic’)
As a director of learner services and support, when monitoring application and recruitment for 2017 / 18, I want to target recruitment activity so that I can increase participation / recruitment and understand conversion rates by geographical area and subject type.
Data Sources
Internal college data from the two participating colleges
- Institution / college statutory returns data (LLWR – Welsh ILR)
- Internal student application, acceptance and enrolment data (historical)
- Internal student application data (current live / in-year recruitment)
External
- School data – Populations and Schools / Pupil Locations (PLASC / Careers Wales)
- Schools achievement and performance (Stats Wales)
- NOMIS – employment and industry demographics
- EduBase – school locations
Data preparation and ETL
- Coding and grouping of courses / students to align with industry standard codes
- Matching pupil census data to college application data
- Matching school location data to college application data
Project Sprints
We broke the high level user story down into manageable chunks to work on each month, summarised below.
Sprint 1 – January
Priority questions for this sprint:
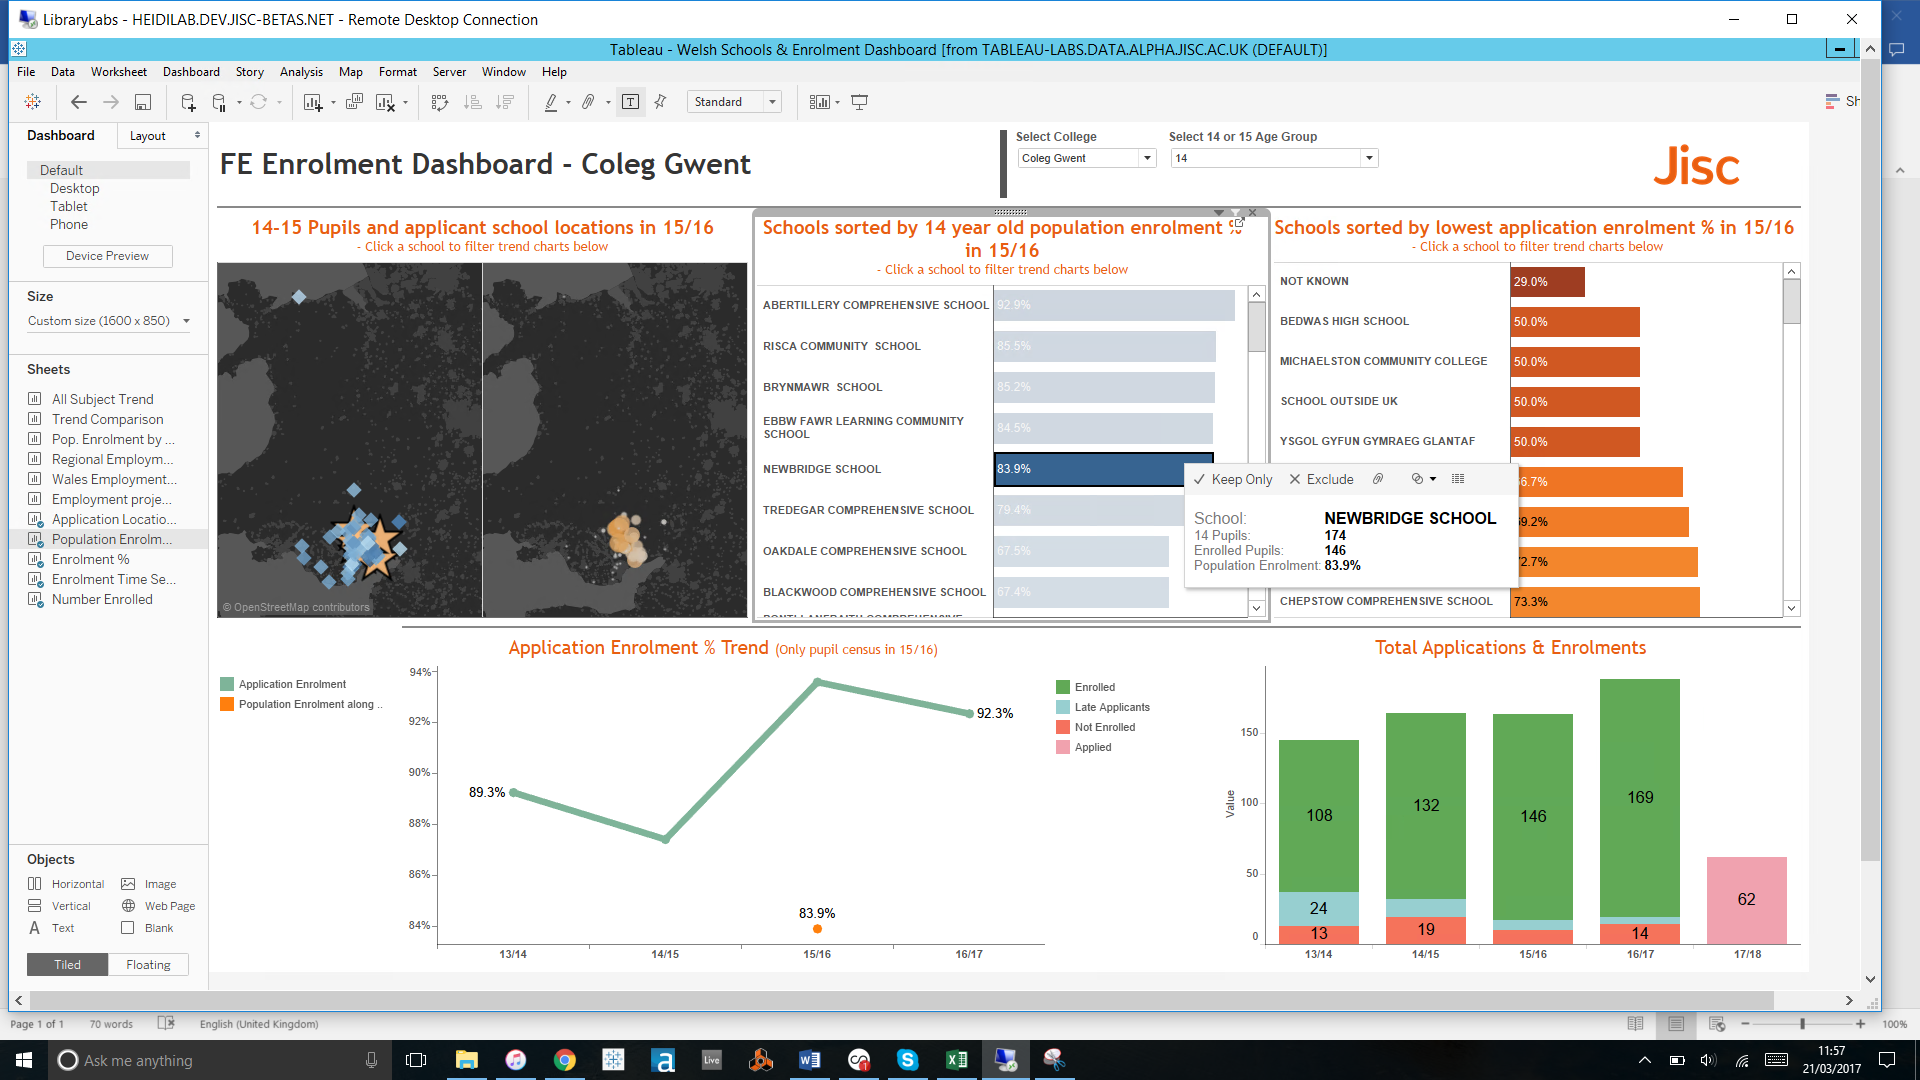
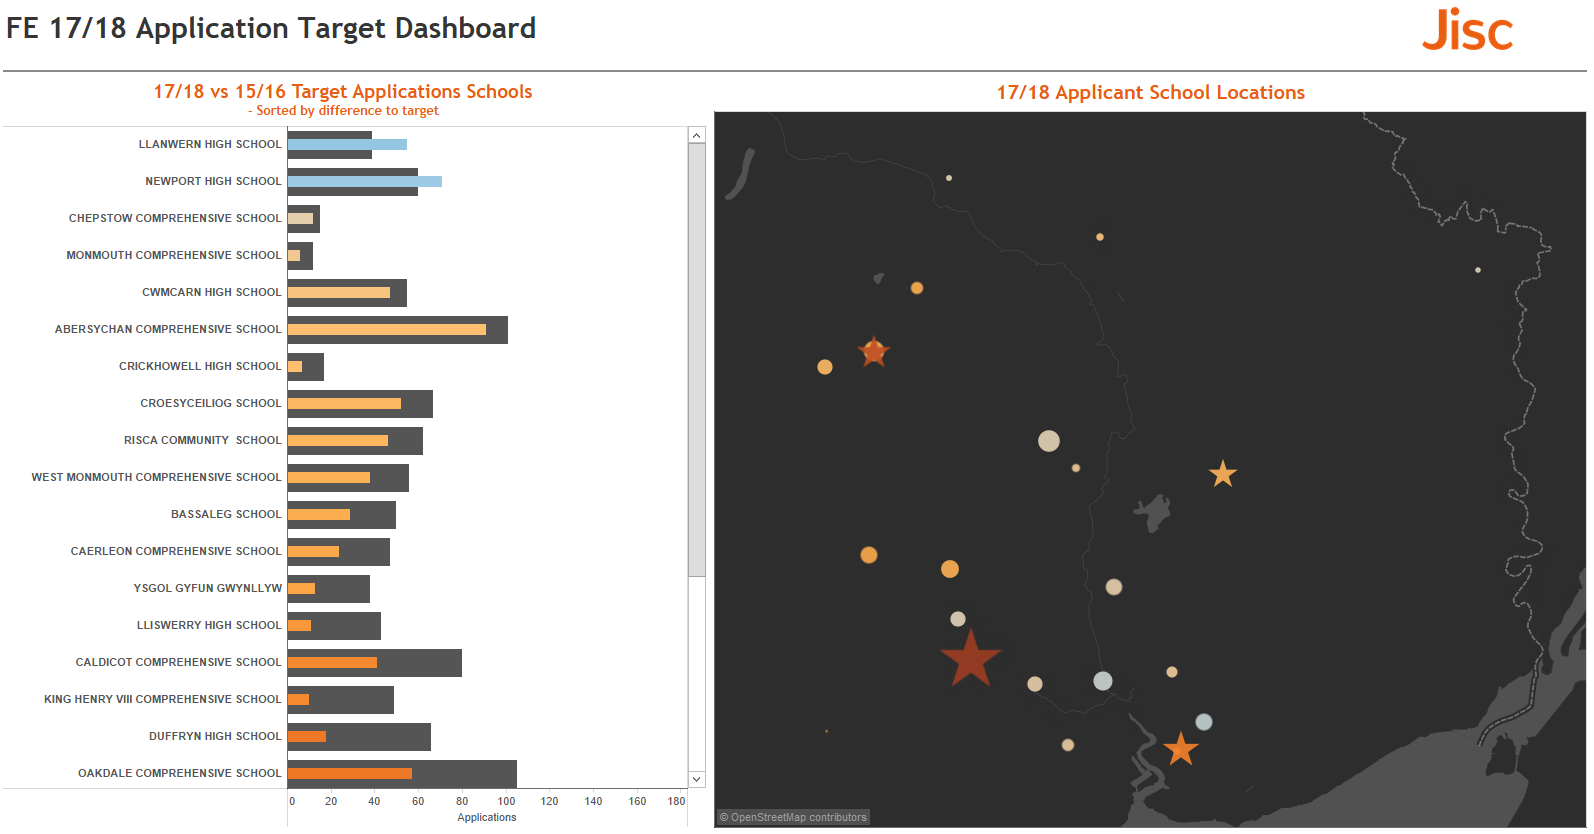
Which schools are we receiving applications from? What are the pupil numbers at those schools and how many are applying?

Welsh School Locations and Pupils by Age Group
“Creating a visual representation of the geographic distribution of source schools to the colleges required some advanced data blending techniques. The data provided by colleges highlighted which schools learners came from, however the location of these schools wasn’t included. Another piece of useful information was the total number of pupils at each school by age group. The difficulty here was that to join each of these data sets together the school name needed to be an exact match, however only 30% of the school names were an exact match.
Fuzzy matching is a more advanced way to match data sets as it looks at individual words and can match based on different criteria (e.g. the phonetic sound of each word of each word). This fuzzy matching approach improved the matched schools to roughly 85% and enabled the joining of both location data and pupil census data to the collages application data.” – Phillip Lowe, Tableau and Alteryx consultant, The Information Lab.
Sprint 2 – February
Priority questions for this sprint:
How are enrolled learners distributed across different subject areas? Is there a particular subject area that seems more popular in one college vs. others? Are there some schools in which there are more learners going to one college over another? What are the trends in course popularity?
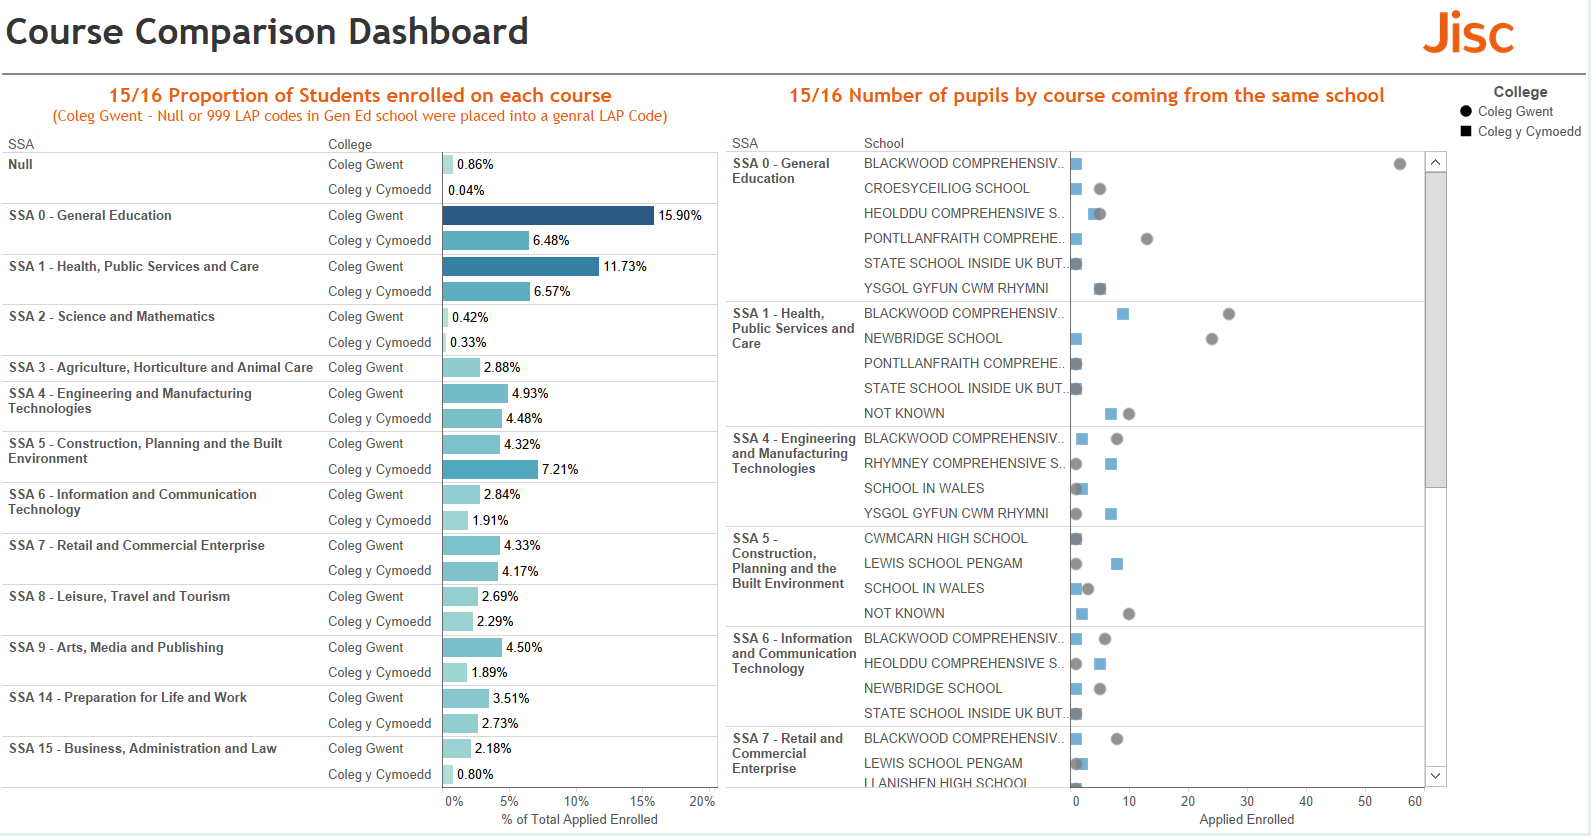
Course comparison dashboard
Understand enrolment trends by course
Sprint 3 – March
Priority questions for this sprint:
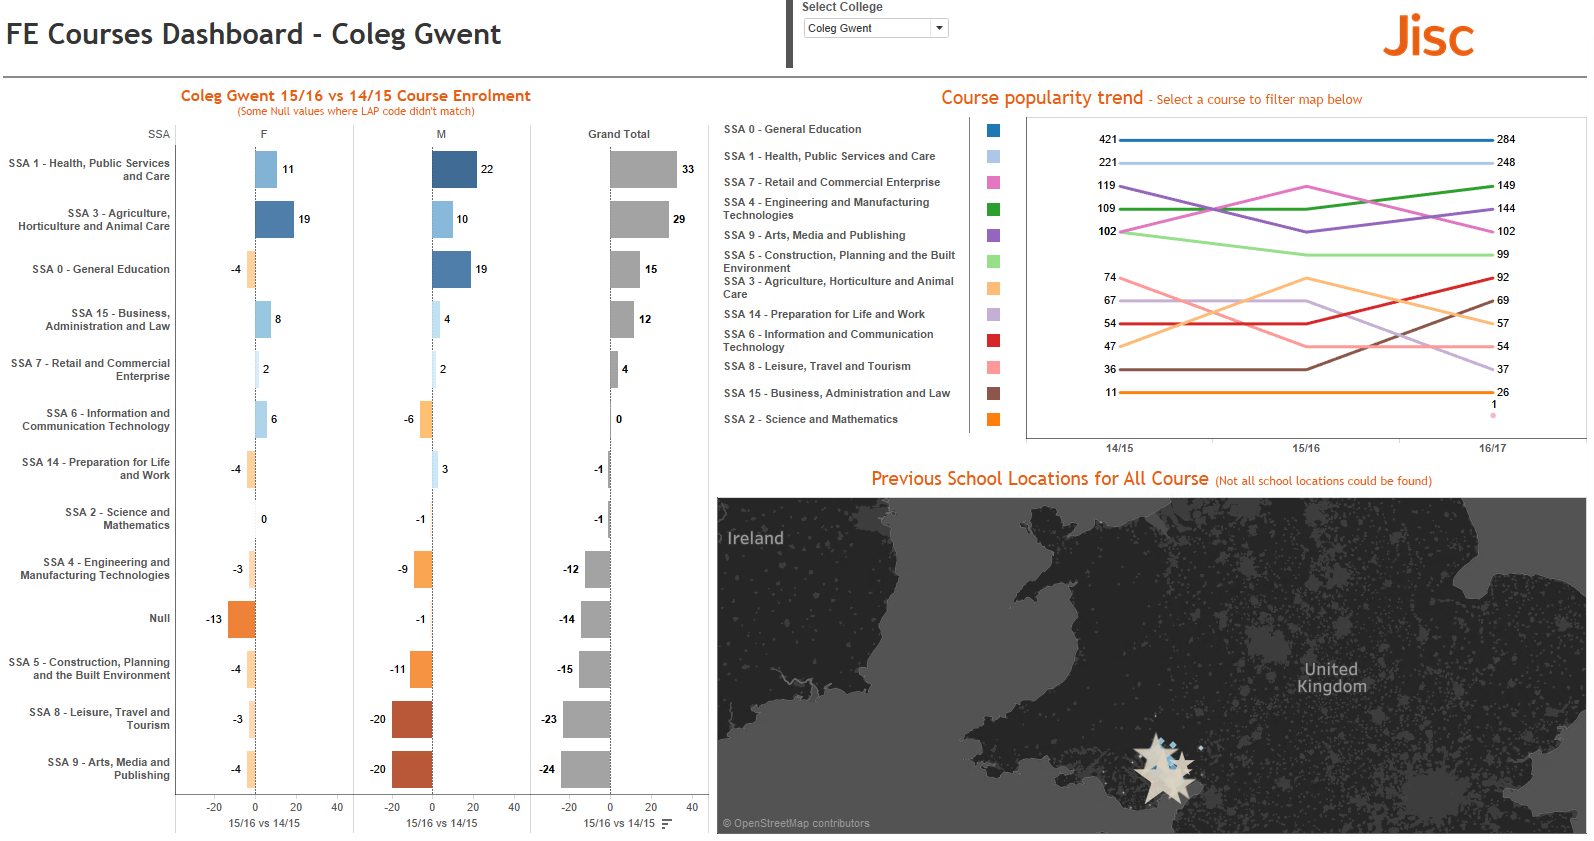
Can we predict enrolment trends? Can we identify areas where recruitment trends from specific schools are increasing? Can we understand enrolment trends by course? How are applications from certain schools comparing to last year’s applications?
Identify areas where recruitment trends from specific schools are increasing
How are applications from certain schools comparing to last year’s applications
Outstanding Benefits, Issues and Conclusions – Ivan Gregory
- Having access to Tableau expertise, along with support (Alteryx) for ETL of external/ additional data sources was invaluable;
- Ability to benchmark against previous years recruitment (at point in time) for geographically co-located campuses/ colleges was useful;
- Potential to further look at student attendance / recruitment, mapping to public transport routes/ maps, to influence curriculum plans / space planning;
- The availability of in-year or near-live data for internal and external data sources would be extremely powerful and enable business decisions (focus or re-focus of recruitment effort or resource) to be made ”just in time”;
- Potential to expand to an all-wales BI and labs project (Colleges Wales);
- Would like to work further with WAG to obtain more detailed regional data and also automated data provision above ILR from a central source;