Co-authored by Martin Hall and members of the Manchester College Analytics Lab team.
Colleges across the UK are facing-ever more complex demands to make their case for funding, and other forms of report. At the same time, government policies both here, and across Europe and North America, acknowledge the need for a new deal for building technical education, training and the skills that are essential for re-securing economic growth. How can the huge and diverse sources of data that are now available be better used to address and inform key policy decisions, in ways that meet both the requirements of national and regional agencies and also the local nuances and concerns of colleges serving immediate communities?
The Jisc College Analytics Lab digital modelling environment provides a means to address complex practice and policy questions using highly diverse sources of data. By engaging both with colleges, with their command of the details of learner data, and regional and national planning agencies, that need to aggregate intelligence across wider areas in order to generate policy recommendations, we hope to make a step change in the quality of provision in this key sector of post-compulsory education
From January – March this year, we ran a three-month pilot to explore possibilities with the involvement of key organisations in the Greater Manchester City Region
Members of the Manchester team:
- Christian Spence, Subrahmaniam Krishnan Harihara, Alex Davies – Greater Manchester Chambers of Commerce
- James Mortlock – Salford City College
- Britta Berger-Voigt – Greater Manchester Combined Authority
- Martin Hall, Shri Footring – Jisc; Phillip Lowe – The Information Lab
Supporting team members:
- Derek O’Toole, Matthew Taylor – Hopwood Hall College
- Rob Wyn Jones, Sue Attewell – Jisc
Business Questions
We explored two separate areas of need.
- How can information about the content of FE programmes be made accessible, in a meaningful way, to both learners and employers? How can we describe the relationship between college programmes, the attainment of competencies and formal qualifications more accurately?
- What do you do, as a college leader, when you need to be part of the city region plan for accelerating apprenticeship starts, but you have a severe shortage of local firms for absorption? How do you reconcile the dependency of learners on campus proximity and affordable transport routes with the rationalisation of provision across the city region?
To answer these questions we used internal college data and, crucially, we were able to “superimpose” detailed employment and other local data shared by GMCC and the New Economy.
Communicating College Programme Content to Employers and Learners
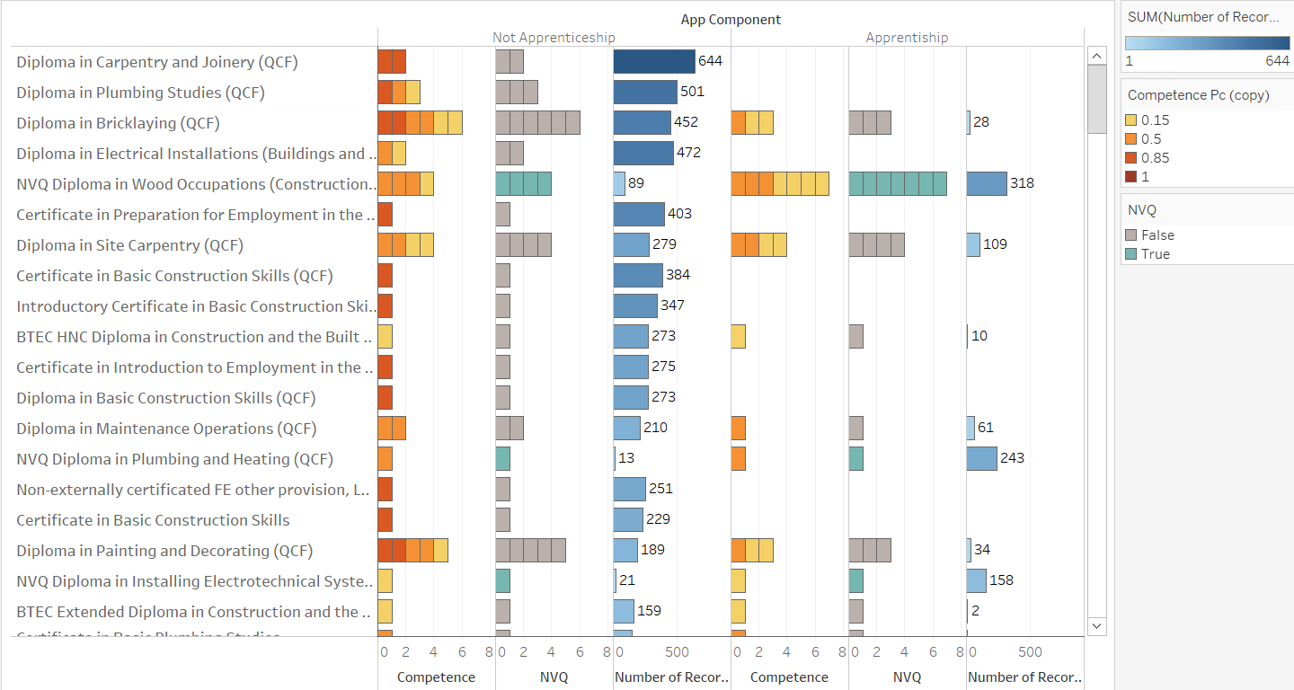
We know that employers value the practical, competence based aspects of a qualification when recruiting. For some qualifications, such as NVQ, the competence element is clear. However other qualifications often also include significant competence based elements which are difficult to communicate and, because of the sheer number available, are not well understood by employers.
We used college data on module content of qualifications and combined it with detailed data gathered by the college on what percentage of each module was competency based.
The visualisation below clearly highlights which courses have more competency element than others as well as showing that a simplistic approach does not give an accurate indication of the competence element of courses. This allows employers to readily identify relevant courses and learners to make informed choices.
Student travel between home, college and employer locations
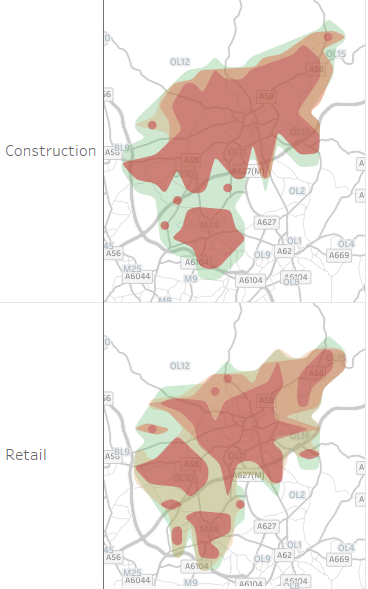
Heatmap showing employer locations in the area. Students’ home locations can be superimposed.
A user story from college point of view:
As the Director of Curriculum Development, when planning next year’s offer, I would like to have an accurate picture of which employers are within easy reach of College Students, with vacancies at the appropriate level, so that can take an informed decision about which curriculum areas to grow / invest in”
A student point of view:
“How far would a I have to travel to get to work / college? How long will the journey take? (How much will it cost?)”
“As a prospective apprentice, when applying for a job / college place, I want to ensure that I am able to travel from home to the location in a reasonable time frame”.
The data used for these visualisations include:
- Student post-code (or out code) – each post code turned into a map coordinate so that it could be used to find the nearest bus stop location
- Public transport routes – the local bus routes needed to be analysed to see which routes passed by the college
- Public transport timetables – the timetables for all stops along the routes going to the college needed to be analysed to calculate how long each trip would take for buses at each stop along the route
- Employer locations – nearby projects were mapped to see how many viable employers were in the local area
- Employer vacancy information, where available
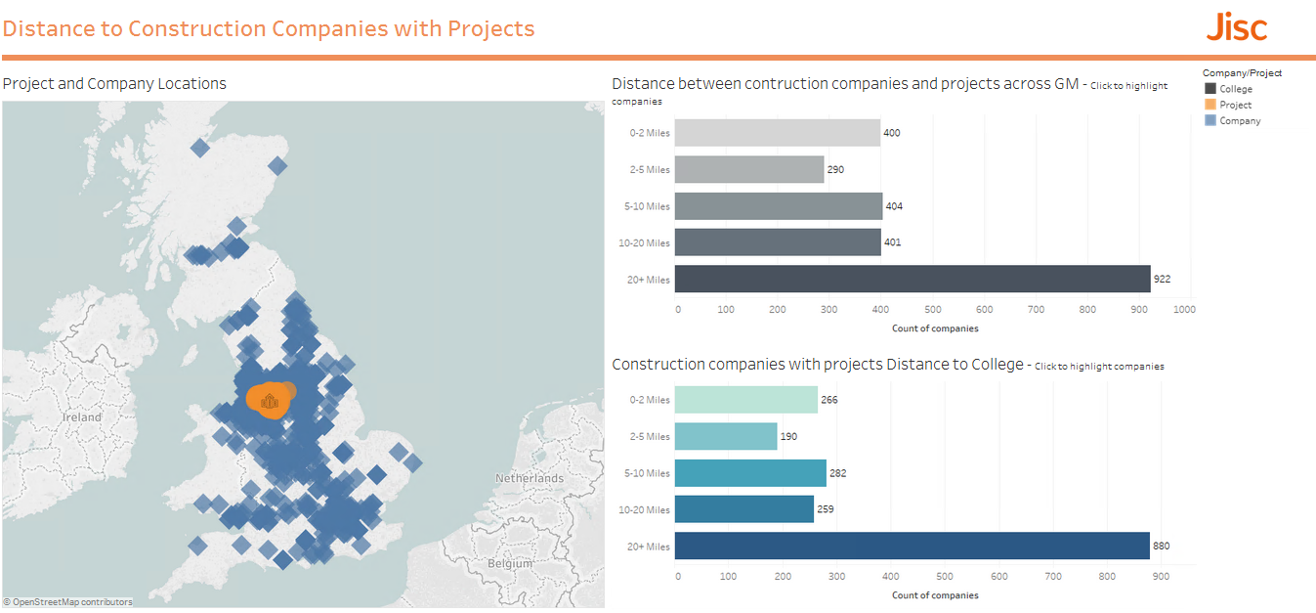
Location of construction companies with predicted skills shortages for projects in Greater Manchester
Potential for the Future
This pilot has demonstrated that by combining college internal data with local and national data sets it is possible to create compelling visualisations that enable data informed decision making relating to the construction sector.
- By clearly showing the competence element of courses offered by the college employers are better able to identify which courses they should favour, and learners are better able to choose course to enroll on.
- By overlaying national employer data and local project data the data dashboards can make it easier for colleges to find appropriate apprenticeship partners that aren’t necessarily locally based.
- By highlighting challenges that learners face, such as transport, local area planning can be better informed.
The College Analytics Lab enables a wide range of organisations who need to work together to do so meaningfully through secure sharing of data, with dashboards that promote a shared understanding of complex issues.